You move your phone ten inches, and your download speed halves. If you’ve ever used a hotspot indoors, you’ve experienced this: phone reception is tricky inside. The reception bars in your status bar are vague. Four bars doesn’t distinguish 75% from 100% signal strength. You need real numbers to find your sweet spot.
Field Test Mode on iPhone
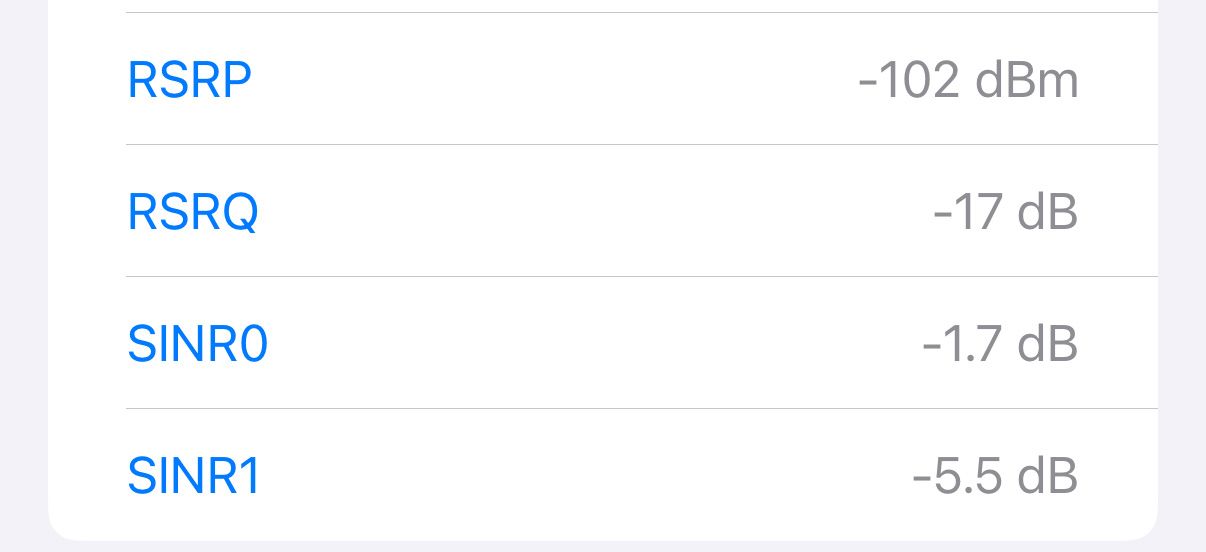
On an iPhone, you can access a hidden diagnostic feature called Field Test Mode. It isn’t in any menu; it’s a secret iPhone code. Open the Phone app, dial 3001#12345#, and hit Call. Instantly, a debug screen appears with metrics updating live.
As you move the phone around your home, these numbers change in real time. Perfect for mapping out the best spot. We’ll get to what these numbers mean in a second.
Advanced Signal Metrics on Android
The story is similar if you’re on Android, but the path depends on your brand and model. Android’s chaos is a double-edged sword: more models, more customizations, less consistency. On my Nothing Phone running Android 15 and NothingOS 3.0, it’s buried in Settings → About Phone → Device Details → SIM Details.
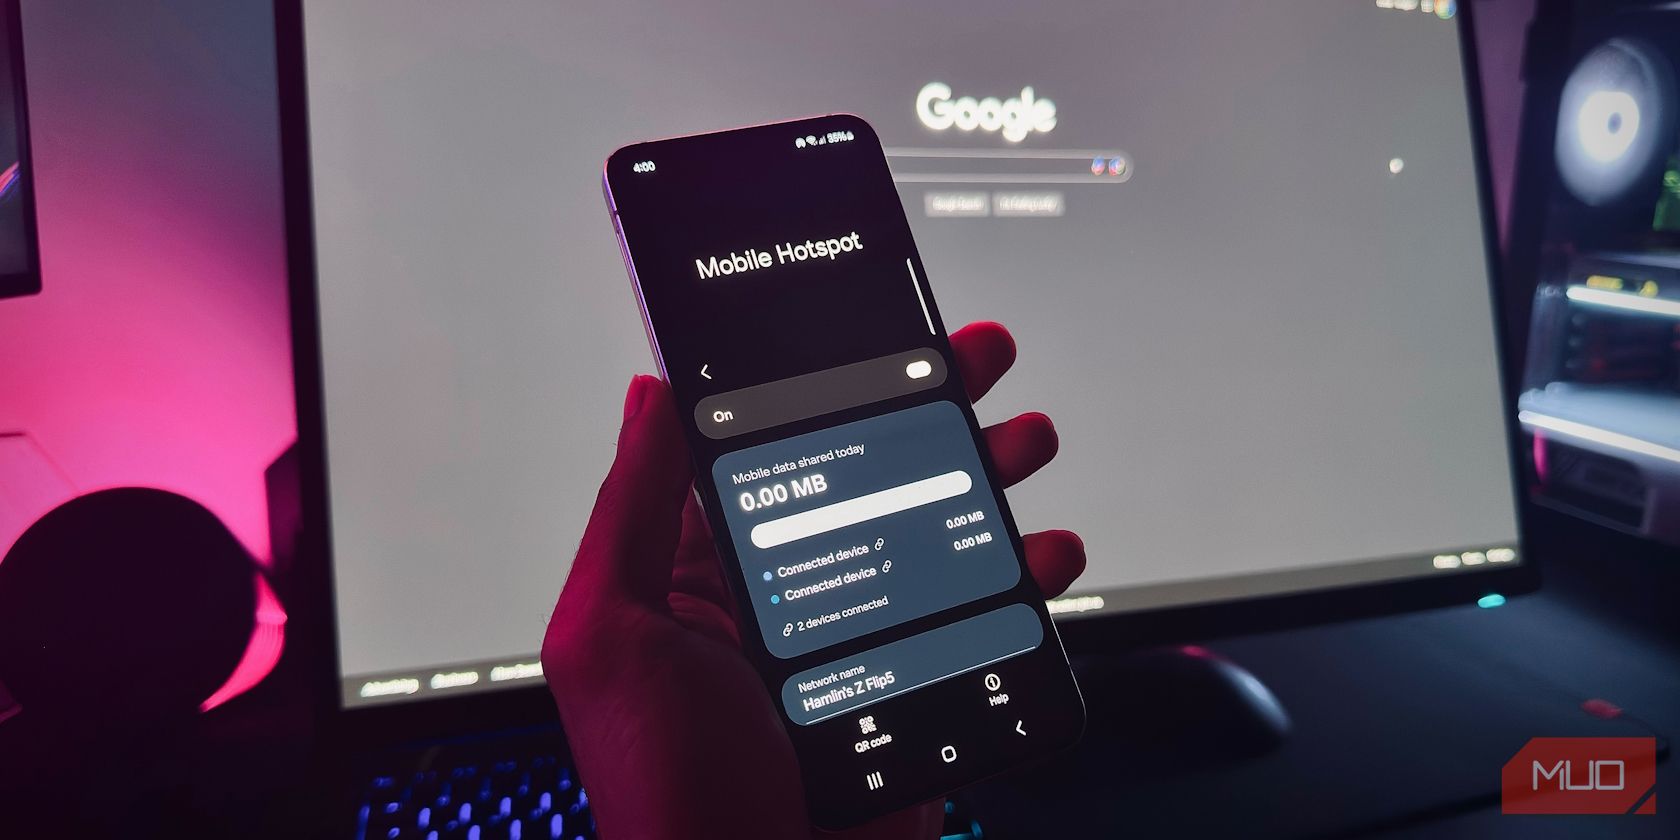
Other Android phones might bury it somewhere else and even show different data. My Nothing Phone gives less data than my iPhone. However, unlike iOS, Android doesn’t gatekeep information. The Play Store is packed with apps that dig deep into cell metrics: CellMapper, NetMonitor, and dozens of others. With these, you get not just the current signal but band info, tower location, and even community-driven maps showing what other people see in your area.
Deciphering Signal Measurements
When you open Field Test Mode or an Android signal tool, you’ll see codes and metrics that may look cryptic at first. Let’s break them down.
The Tracking Area Code (TAC) is a number the network uses to group towers for paging and location updates. You’ll also see a PLMN code, which identifies your carrier and country. These are mostly network-side information. What we care about is the RSRP, RSRQ, and SINR.
Reference Signal Received Power, or RSRP, measures the average power of the LTE reference signal in decibel‑milliwatts (dBm). The closer that number is to zero, the stronger the signal. As you walk from one end of your apartment to another, RSRP will climb and fall in steps, visually revealing where the best reception lies.
RSRP Value (dBm) | Signal Quality |
|---|---|
-80 to -90 | 🟦Excellent |
-91 to -100 | 🟩Good |
-101 to -105 | 🟨Fair |
-106 to -110 | 🟧Poor |
-111 to -120 | 🟥Weak |
-121 and below | ⬛No signal |
Complementing RSRP are Reference Signal Received Quality (RSRQ) and Signal‑to‑Interference‑plus‑Noise Ratio (SINR). RSRQ compares the reference signal against all received power, so a figure closer to zero means less interference.
SINR, on the other hand, shows how much of your received signal is actually a useful signal versus noise; a positive SINR indicates a clean channel, while a negative reading means noise is drowning out your signal.
While RSRP shows you raw strength, RSRQ and SINR reveal whether that signal can carry high‑speed data. Even if RSRP is strong, poor quality metrics throttle your connection to lower modulation schemes and cap your throughput.

Hardware isn’t the only factor
My 6 Handy Tips for Boosting Your Mobile Hotspot Speeds
Boost your mobile hotspot speeds with these easy-to-implement tips and tricks.
Hunting Down Your Home’s Sweet Spot
Of these three metrics, RSRP is the one you can directly influence by repositioning your phone. I discovered that placing my phone on a kitchen windowsill, just a meter above the floor, boosted my RSRP from around –120 dBm to nearly –80 dBm.
Because RSRQ and SINR depend on network load and ambient interference, they often fluctuate with the time of day and how many neighbors are streaming video. If those numbers dip too low, your only options are switching to a less congested band—a feature that’s available on Android but not on iOS.
The band information is handy if your phone lets you manually choose one. For example, mid‑band around 2.6 GHz offers more capacity but struggles with indoor penetration, while lower bands near 800 MHz travel through walls more easily.
The truth is, RSRP is the only metric you can consistently influence inside your home. RSRQ and SINR depend on network congestion, time of day, and your neighbor’s habits. So, bring up the signal metrics, walk around your house, and hunt down that sweet spot. For me, it was the windowsill in the kitchen. I have a suction mount on my case, which lets me slap my phone on the window.
Don’t ignore your Wi-Fi. Even if your phone is perfectly placed for cell signal, your PC needs to reach its hotspot too. Find a compromise.
I’ve also noticed that my Nothing Phone 1 consistently gets better signal and faster speeds than my iPhone 16 Pro, even though both use the same carrier. In areas where the Nothing Phone shows 5G, the iPhone often drops to LTE.
That tells me one of two things: either the Nothing Phone has a better modem, or it’s simply more compatible with the network bands my carrier uses. Either way, if you want to squeeze out the best performance, use the better device as your hotspot.

Related
How I Maximize My Mobile Hotspot Without Blowing Through My Data Cap
Stretch your hotspot data like a pro.
Walls, windows, furniture, and appliances all conspire to sap signal strength, even when you live next to a cell tower. I’ve experienced this firsthand as I’ve leaned on mobile data more during power outages in my area. A tiny shift in my apartment, sometimes mere inches, would send my download speed and connection stability swinging wildly.
Your house has a cell signal sweet spot, whether you know it or not. A two-minute walk with Field Test Mode open can mean the difference between a flaky connection and a rock-solid hotspot.


Leave a Comment
Your email address will not be published. Required fields are marked *